





Quick Takeaways
- A filter statement tells you what you asked for; a visual segment shows you what you got.
- Venn, waterfall, and matrix views display the same contacts three ways, each counting live.
- Geographic maps let you read audience size by region at a glance.
- Every count is a live query against your own data platform, not a static mockup.
- A finished segment saves to Eloqua as a shared list, and exports can be scheduled daily, weekly, or monthly.
- Selections run read-only against the data warehouse you already own, so sensitive data stays in your system.
Table of Contents
A saved segment hands you a list of rules. It confirms what you asked for, but it never shows you the audience you actually got. The overlap with the campaign shipping next week, the branch that returns nobody, the contacts already queued for three emails this week: none of it appears in a filter statement. You find out after the send.
In our Eloqua Office Hours Aug 2026 session, we put those hidden audiences on a canvas. Over thirty minutes, we showed visual segmentation running live on your own Snowflake data: we built segments as pictures, watched the counts move in real time, and turned a finished segment into an Eloqua shared list. If you missed it, or want to send it to your team, the full recording and recap are below.
Why a Filter List Hides Your Real Audience
Filter logic is a fine way to tell a system what to do. It is a poor way to describe a group of people, and that gap is exactly what visual segmentation for Eloqua is meant to close. Past about three conditions, you are nesting parentheses, and the statement stops reading like a description of an audience at all. Two problems follow. You cannot see who is in the segment until you run it, so the review happens after the work instead of before. And when the fields you need for Eloqua segmentation live in a data warehouse like Snowflake or BigQuery, you export them into Eloqua first and hope the mapping holds.
The cost compounds in three ways: time, because every condition is another nested clause and another review pass before anyone trusts the list; certainty, because you do not know who is actually in the list until you run it; and risk, because each exported copy of customer data is one more thing to secure and keep in sync. A campaign sent against a stale export is an expensive way to learn this, and it is the everyday reality that visual segmentation was built to replace.
Build the Audience as a Picture
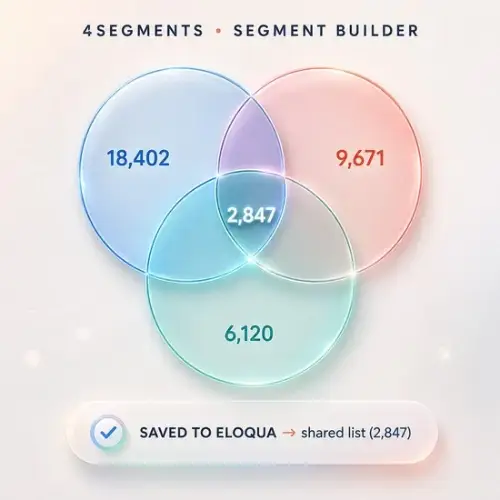
The alternative fits in one sentence: build the audience as a picture. That is visual segmentation in practice: each circle is a population sized by how many records it holds, and the overlaps are exactly what you would expect. In the live demo, we used 4Segments to drag a country, an industry, and a job title onto the canvas, read the intersection as a live count, and reshaped it on the spot, swapping the whole country for a single state, trading a manager title for a director title, and layering a lead-score band, until the audience was the right size to send to.
Because every query runs on your warehouse, this is Snowflake segmentation happening in real time, not a static export. We showed the same contacts three ways. The Venn diagram is where this idea started, more than a decade ago. The matrix crosses two fields, such as country and industry, and shows every top intersection at once.
The waterfall stacks intersection on intersection, country, then industry, then job title, then lead status, so you can see where the audience falls away at each step. A funnel view shows where leads sit by status, and a world or US map reads audience size by geography. Each of these is simply a different way to build Eloqua segments without writing a single Boolean rule.
From Picture to Shared List
When the segment looks right, it becomes something you can send to. In 4Segments, a finished segment saves straight to Eloqua as an Eloqua shared list, in the folder you choose. You can also export to CSV or Excel, to an SFTP destination, or to Marketo. And you can schedule the export to run daily, weekly, or monthly, so a segment you build keeps feeding a live campaign over time rather than being rebuilt by hand. That schedule is what turns a one-off Eloqua shared list into a standing audience.
Your Data Stays in Your System
Every number on the canvas is counted inside your own data warehouse. A scoped, read-only service account, one your team owns, scopes, and can switch off, connects to your data platform. Record-level data is read only when you preview a list or export a finished segment, and only that finished Eloqua shared list is pushed to Eloqua. This session ran on Snowflake, with a live BigQuery connection standing by, so Snowflake segmentation and the same approach on other warehouses run against the platform you already own. The same architecture connects Snowflake and other data platforms.
The demo also included an AI assistant that summarizes how your data has shifted over a window you choose, up to 30 days, and can draft a segment from a plain-language request, confirming which data source to use first. As covered in the live Q&A, that assistant reads only the counts and field names stored inside 4Segments, not the records in your warehouse.
Watch the Eloqua Office Hours Aug 2026 Session
Presented by Al Arceo and Adrian Pacheco of 4Thought Marketing, with Richard Holder hosting the Q&A.
Conclusion
A filter list will always tell you what you asked for. Seeing the audience, the overlaps, the empty branches, the segment you never thought to write down, is what visual segmentation gives you, and it lets you fix a segment before the send instead of after. That was the throughline of Eloqua Office Hours Aug 2026: build the audience as a picture on the data you already trust, then push the finished result into Eloqua as an Eloqua shared list. Watch the recording above, and when you are ready to try this against your own data model, start a conversation with our team.
About 4Thought Marketing
We're a B2B marketing automation and AI consultancy with a thing for getting complex tech to actually work. Since 2008, we've helped hundreds of organizations across financial services, technology, manufacturing, and real estate get more from Eloqua, Marketo, and their CRM integrations. We serve our clients across marketing automation strategy, lead lifecycle, AI, compliance, preference management, and more. Explore our services or get in touch.
Frequently Asked Questions
How do you add a new segmentation criterion?
In the configuration section, which is for admins, you choose the data source, the table, and the column you want, give it a name, and set how many top values to auto-populate. The values load from your warehouse, and the new criterion is then ready to drag onto a canvas.
Can the AI assistant see or interact with my data?
No. The AI assistant reads only the counts and field names stored inside 4Segments. It does not read the record-level data in your Snowflake or other data warehouse, so your data stays entirely on your own compute.
Beyond Snowflake and BigQuery, what data platforms are supported?
MySQL is supported today, and the team can add connections to other data warehouses quickly. In the live Qu0026A, Databricks was named as one being added. Eloqua segmentation works the same way whichever platform you connect.
Does our data ever leave our account?
No. Only the finished Eloqua shared list is pushed to Eloqua. Selections run as read-only queries against your own platform, and record-level data is read only when you preview a list or export a segment.
Do you offer proof-of-concept engagements?
Yes. 4Segments is configured against your own data model, so it starts with a short scoping conversation. If Eloqua Office Hours Aug 2026 got you thinking about your own audiences, reach out and we can set up a proof of concept.